El carrito está vacío.


Descargar muestra
Detalles del fichero
Publicado: 2024-10-29 13:59:13.021353 Categoría: Graphic Resources Tipo: illustration Model release: No
Share
       

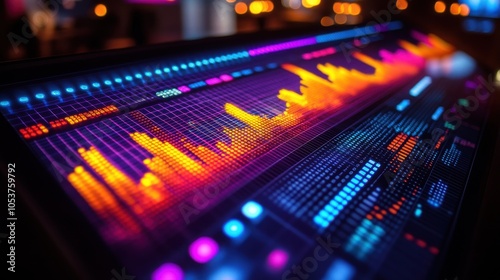
A dynamic candlestick chart showcases market fluctuations, with red and green bars illustrating price movements. This digital representation highlights trading activity and trends.

Contributor: Dmitriy
ID : 1053759792

Títulofilesize
illustration5824x3264


Buy on Adobe Stock

Palabras clave
finance, trading, market, candleholder, chart, analysis, stock, price, digital, investment, trend, datum, economic, green, red, optical, technology, rise, fall, strategy, tool, financial, indicator, graph, volatility, platform, stock, share, decision, technical, investor, floor, price, action, economic, market, visualisation, technique, performance, risk, management, trade, profit, loss, speculative, generative, ai